CPU Benchmarking Guide
AMD or Intel, this is how we (and you should) test your processors

AMD or Intel, this is how we (and you should) test your processors
Now for CPU testing in general, we’re actually going to keep things quite simple, at least for the time being. The plan is to expand on this a little later down the line with some more computationally heavy tasks, including more rendering tests and a few other elements (next gen, promise). But for the moment the focus is on a couple of synthetic tests (Cinebench and Blender) giving us a good idea of single-core and multi-core performance, and then game performance across the three key resolutions.
Ideally we’re looking for games with benchmarks that are easily repeatable, heavily biased towards CPU load, and that represent the wider spectrum of AAA genres being played. For that reason, we’ve gone with Total War: Warhammer 3 and its Mirrors of Madness benchmark, Cyberpunk 2077, and Final Fantasy XIV: Dawntrail as well.
To cap it all off, we’re running a couple of fairly old-school 3DMark tests here too, just to give us some heavy synthetic load numbers under both DX11 and DX12, and we’re going to be running some fairly comprehensive temperature and power draw testing throughout too.
So, a couple things to consider first. If you want to go all out, you’ll need a plug-in power meter to measure total system wattage drawn. Now this is more relevant for the PCB crew (still just me), as we’re testing multiple chips on the same system, so it might not be perfect for you, but these are relatively affordable and available from Amazon at the very least.
Next we also need to note ambient temperature, as this is going to directly impact our max and average temperatures throughout testing.
With that done, we’re going to need to download HWInfo to keep track of our temperatures and also do a little BIOS setup to ensure everything’s running as needed.
So the critical element we’re watching here in particular is temperatures and performance scores. We’re going to perform both Cinebench 2024 and Blender first, with HWInfo operating in the background to tell us max clock speed and average and max temperature.
After downloading the benchmark, load Cinebench up, and allow it to prepare its first render (little loading bar on the bottom). Once complete, hit reset on your power meter (changing the display to max W drawn), and then hit reset on HWInfo. Once HWInfo is reset, immediately run Cinebench’s multi-core test.
As this test runs for at least 10 minutes, we’ll only be doing a single run. As soon as the run is finished, note the average temperature immediately, then the max temp and power draw along with the score.
Then you can run the single-core test. Naturally, as this is less intensive, both temperatures and power draw will be lower, so there’s no need to monitor.
For Blender, we’re going to be downloading the Blender benchmark and using version 4.4.0 once it’s installed. Similar to with Cinebench, we’re going to get to the “device selection” screen, then hit reset on HWInfo, and finally, start the test, noting the score, power draw, and average temps over the course of the benchmark, then listing the index score for Junkyard.
You can then run it again for GPU as well. Similarly, as we’re not directly expecting a huge amount of load on the CPU here, measuring CPU temps and power draw is not necessary, although it will give us a good inclination as to whether the GPU/CPU combo is responding appropriately to the load.
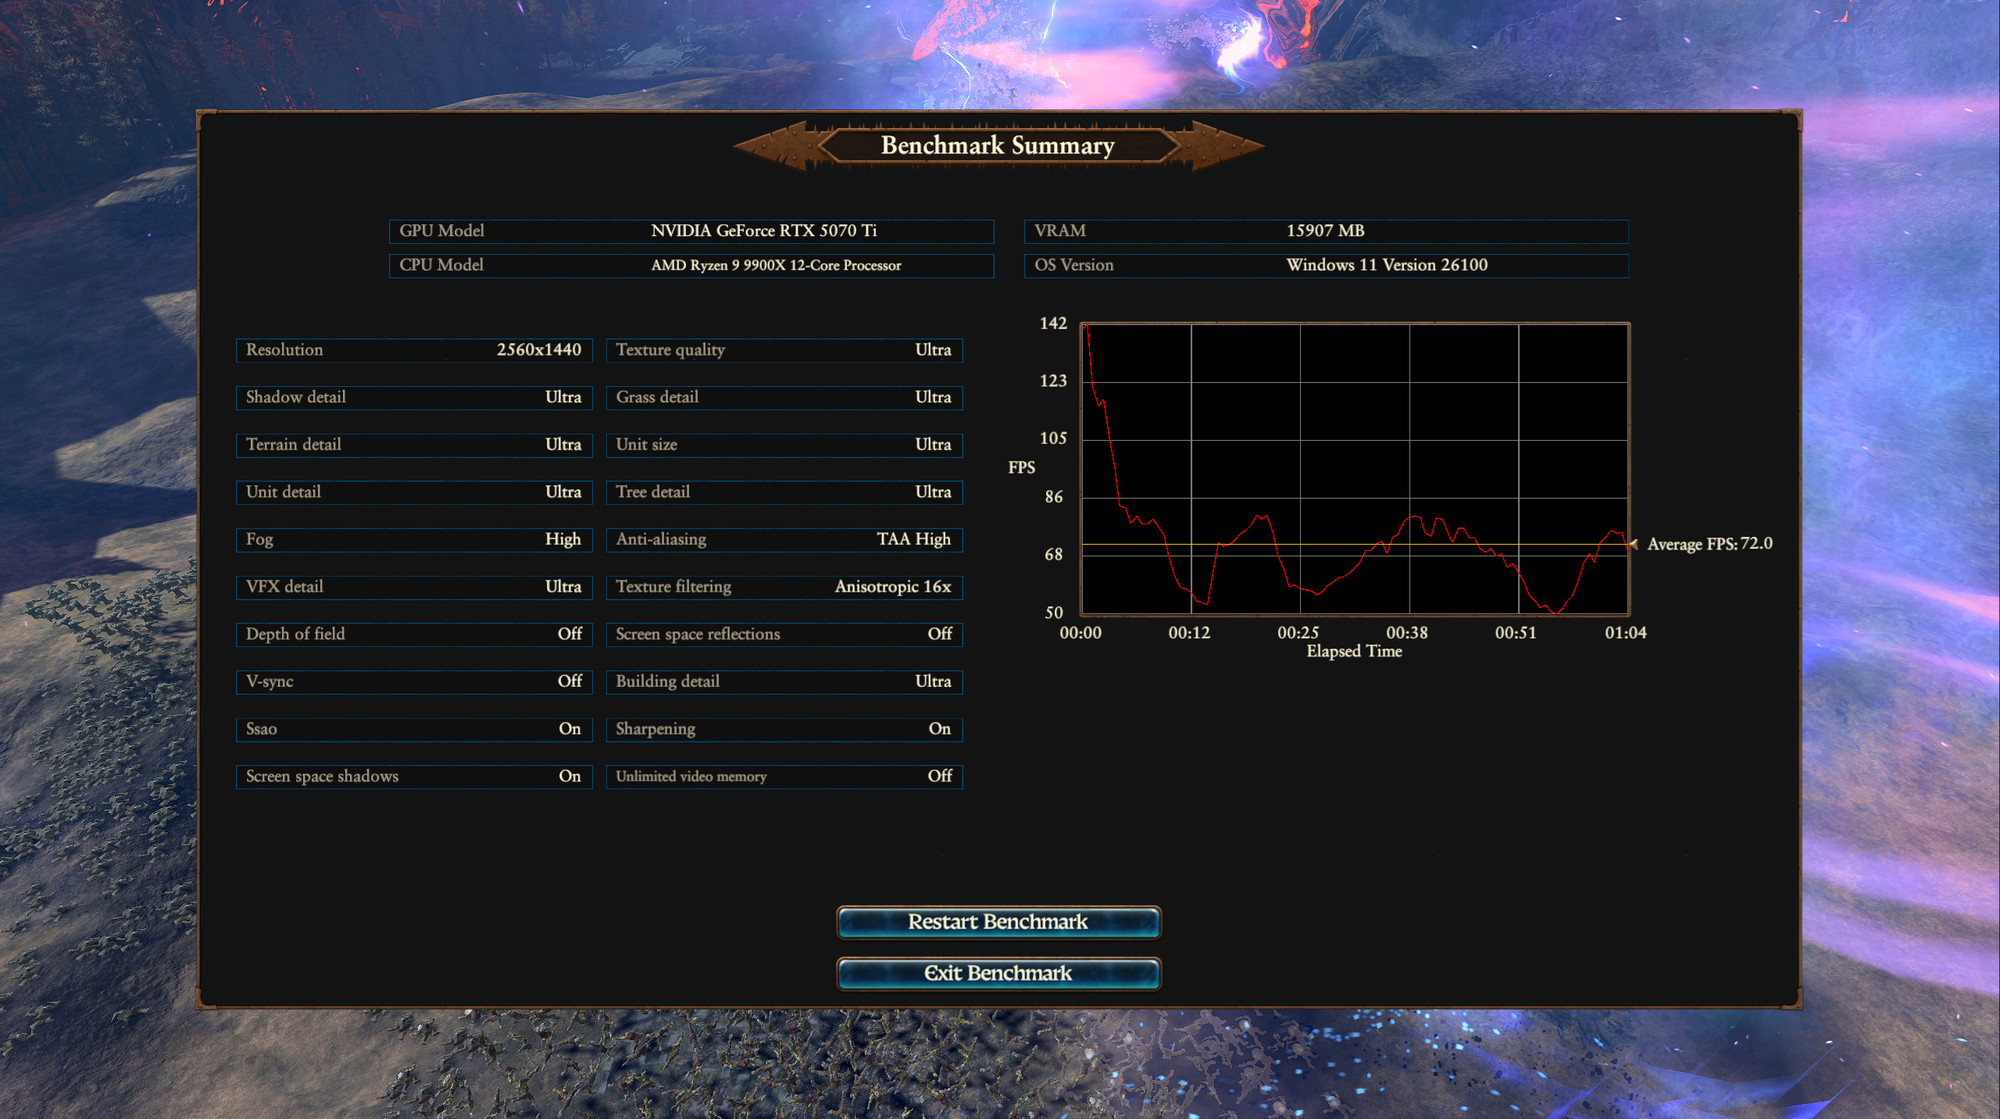
So the idea here is that each game is benchmarked at each key resolution three times, noting the minimum and average frame rates. As the tests are relatively short, we run each benchmark three times and then draw an average from the three results. Not only does this allow us to spot any outliers in the results (potentially artifacts resulting from issues or other programs), but it also gives us a nice smooth average too.
In the case of our average temperature and power draw, we measure this over the course of the three runs on that resolution, then once it’s finished, take note of the results, change the resolution to the next one we need to test, reset both the power meter and HWInfo, and then repeat the process. You’d be surprised just how much variance can occur over resolutions, per game, from a temperature and power draw perspective.
The simplest of our game benchmarks to configure. With little in the way of AI upscaling or frame generation to consider.
As our testbed GPU is an RTX 5070, and we’re trying to get as many frames out of it as possible to stress the CPU, we’re going to enable both DLSS and AI MFG for these runs. If you’re utilizing an AMD card, similarly, you can use FSR 3.0 and AI Frame Generation to simulate these tests.
FFXIV is a little bit of an interesting one, as it’s a standalone, free-to-download official benchmark from Square Enix that you can download here. MMOs are notoriously CPU heavy, and given its popularity, it’s a default pick for us. Dawntrail was the first expansion in a long while to increase the recommended system requirements for FFXIV, which is why we picked it.
Lastly, we’re also going to be doing some very basic Timespy and Firestrike runs to max out the CPU for both DX11 and DX12. Again, we’re going to run these three times and take temperature and power draw readings for both to get a good understanding of the performance here too, but it’s very much a click-and-go button. We’re looking for just the overall score, and then we’ll average that out three times.
You may notice we also run a multitude of different indexes as reference points as well. These are effectively based on having a complete set of data for all the other tests.
The first of which is our averages per resolution. We effectively take the minimum fps and average fps of our three games, per res, then divide them by three to get the effective frame-rate result across all of the three titles.
Now this isn’t indicative of much, but what it does do is give us a quick, clean, easy number that we can then use to compare that processor against other processors in the benchmark list without going across each game one by one. It’s a rapid way of ranking each chip based on overall performance.
We also do the same for power draw and temperatures as well, as again, that’s incredibly useful information analysis.
Once we have that data, we can then figure out the value proposition for each chip in each general scenario. Those are gaming, professional performance with multi-core, and professional performance with single-core.
In this scenario, we’re dividing the total performance in each category by the current retail price of the product. What that does is give us an index per $ or £, which will allow us to quickly and easily identify how cost-effective a part is. So for multi-core performance, we take our Cinebench multicore index and divide it by the RRP, and that will spit out the number of points achieved per $ spent. You can then do the same for single core. For gaming, we take those average frame rates per resolution we calculated earlier and then again divide by the cost per $, to find how many fps each chip generates per dollar spent.
When it comes to testing tech, it's quite the laborious process at times. It's best to sit and watch each run, look for any graphical anomalies, crashes, lock-ups, any performance issues, stuttering, or screen tearing. It all adds up.
One thing I didn't mention was clock-speed too. Watch how your chip behaves under load, and note its max frequency over the course of the run, this'll give you a good long-term indicator of how it's performing. Take note of it. Same goes for temperature too, both your processor and how it's impacted by ambient, by cooling, by your fans. Basically if something can have an impact on it, think about it, and make a note of it.
The TL;DR is that, effectively, it's quite easy to benchmark a CPU in the modern era, but it's how interpret those results, and spot patterns, that really gives you a good indicator as to how that processor performs.